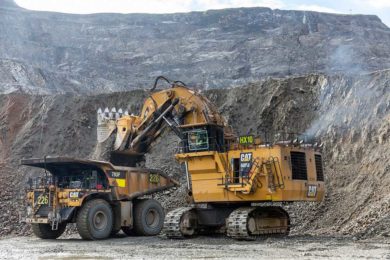


Based on new information and announced project developments , the International Copper Study Group (ICSG) projects that annual mine production capacity over the 2007 to 2011 period will grow at an average rate of 5.3%/y to reach 22 Mt in 2011, an increase of about 5 Mt (30%) from that in 2006. Of the total increase, copper in concentrate capacity is expected to increase by 3Mt (average of 4%/y) and SX-EW production by 2.1 Mt (10%/y). South America and Africa will account for more than 3.2 Mt (66%) of the mine capacity increase. IM’s August issue will examine technologies and innovative methods to help raise output.
Annual smelter capacity is projected to grow by an average of 2.9%/y (about 1%/y lower than the projected growth in concentrate capacity) to reach 18.8 Mt in 2011, an increase of 2.5 Mt (15%) from that in 2006. Primarily due to several project expansions and startups in China, the smelter growth rate averages 3.3%/y during the first three years and is projected to exceed the corresponding annual concentrate growth rate over that period. The situation will be reversed beginning in 2010 when significant new concentrate capacity comes on stream . Assuming that smelter capacity utilization rates rise from the current low level to their historical average, smelter capacity over the entire forecast period should be sufficient to treat additional concentrate production. Short-term shifts in the concentrate supply-demand balance could occur, however, from the unequal distribution of growth.
The ICSG projects that world refinery capacity will reach 25.2 Mt in 2011, an increase of 4.5 Mt (22%) from that in 2006. About 2.5 Mt of the expansion is expected to come from electrolytic refineries and 2 Mt from EW capacity. The average growth rate over the period 2007-2011 for electrolytic refineries is projected to be 2.9%/y, about the same as the projected growth in smelter capacity, and the growth rate for electrowinning capacity (at the refinery level) is expected to be 10%/y. China (through electrolytic) and Congo (through EW) will contribute about one half (2 Mt) of the total world refinery capacity rise.
ICSG projections include capacity at mines and plants that are currently on care and maintenance or are temporarily operating at reduced production levels (swing capacity). According to ICSG research, the current swing capacity for mines is minimal. Total idled capacity for smelters is around 180,000 t, and idled refinery capacity is about 390,000 t.
The ICSG has released the December 2007 Directory of Copper Mines and Plants that covers the period from 2006 to 2011 on a plant by plant basis and which incorporates capacity changes revealed through November 2007. The Directory also presents the long-term (20-years) development of capacities on a world total basis (tabulated by production process) and 10-year summary data by country. The Directory is available for sale at the following rates for clients located in ICSG member countries(see www.ICSG.org)/non-member countries: single issue €400/€600, annual subscription €500/€750. Contact ICSG for purchasing details ([email protected]).
Twice a year, the ICSG releases its Directory of Mines and Plants. The Directory provides basic data for all copper mining, smelting and refining operations on a world-wide basis and projects the development of future capacities for these operations. Each issue is complemented by a list of the web addresses of companies, enabling a quick and easy access to more company details. The database is continuously updated to reflect recent announcements and operational changes .
The Directory highlights capacities for over 800 existing and planned copper mines, plants, and refineries on a country by country basis, including separate tables for SX-EW plants. Salient details for each operation are included and the Directory separates operations between ‘Operating and Developing’ and ‘Planned (Exploration and Feasibility)’ stages. Each issue charts long-term development of capacities (20 years) for World totals, broken down by production process, and summary data for each country for a 10-year period. The detailed tables of operations show the capacities for a base year and the projection of capacities for five years. These projections can serve as a basis for forecasts of the supply side development for copper.